Debug and Profiling
Debugging Node.js
Enable Inspector
node --inspect="127.0.0.1:9229" server.js
Chrome
How to Debug NodeJS Apps Remotely with Chrome Devtools (Under 10mins): https://www.youtube.com/watch?v=lG7GfCOe-w4
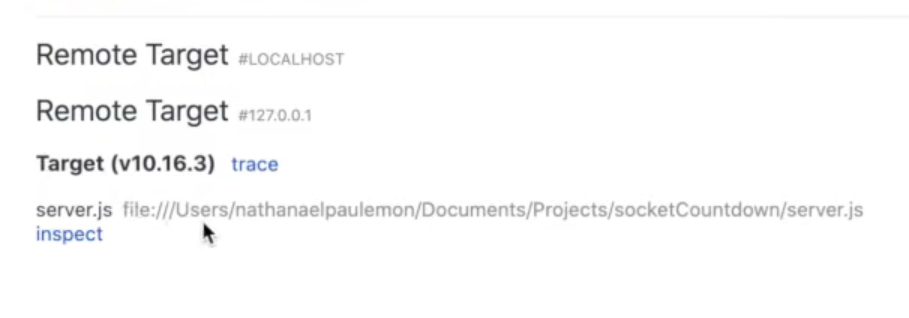
Go to chrome://inspect/

Click Configure... button

Click inspect

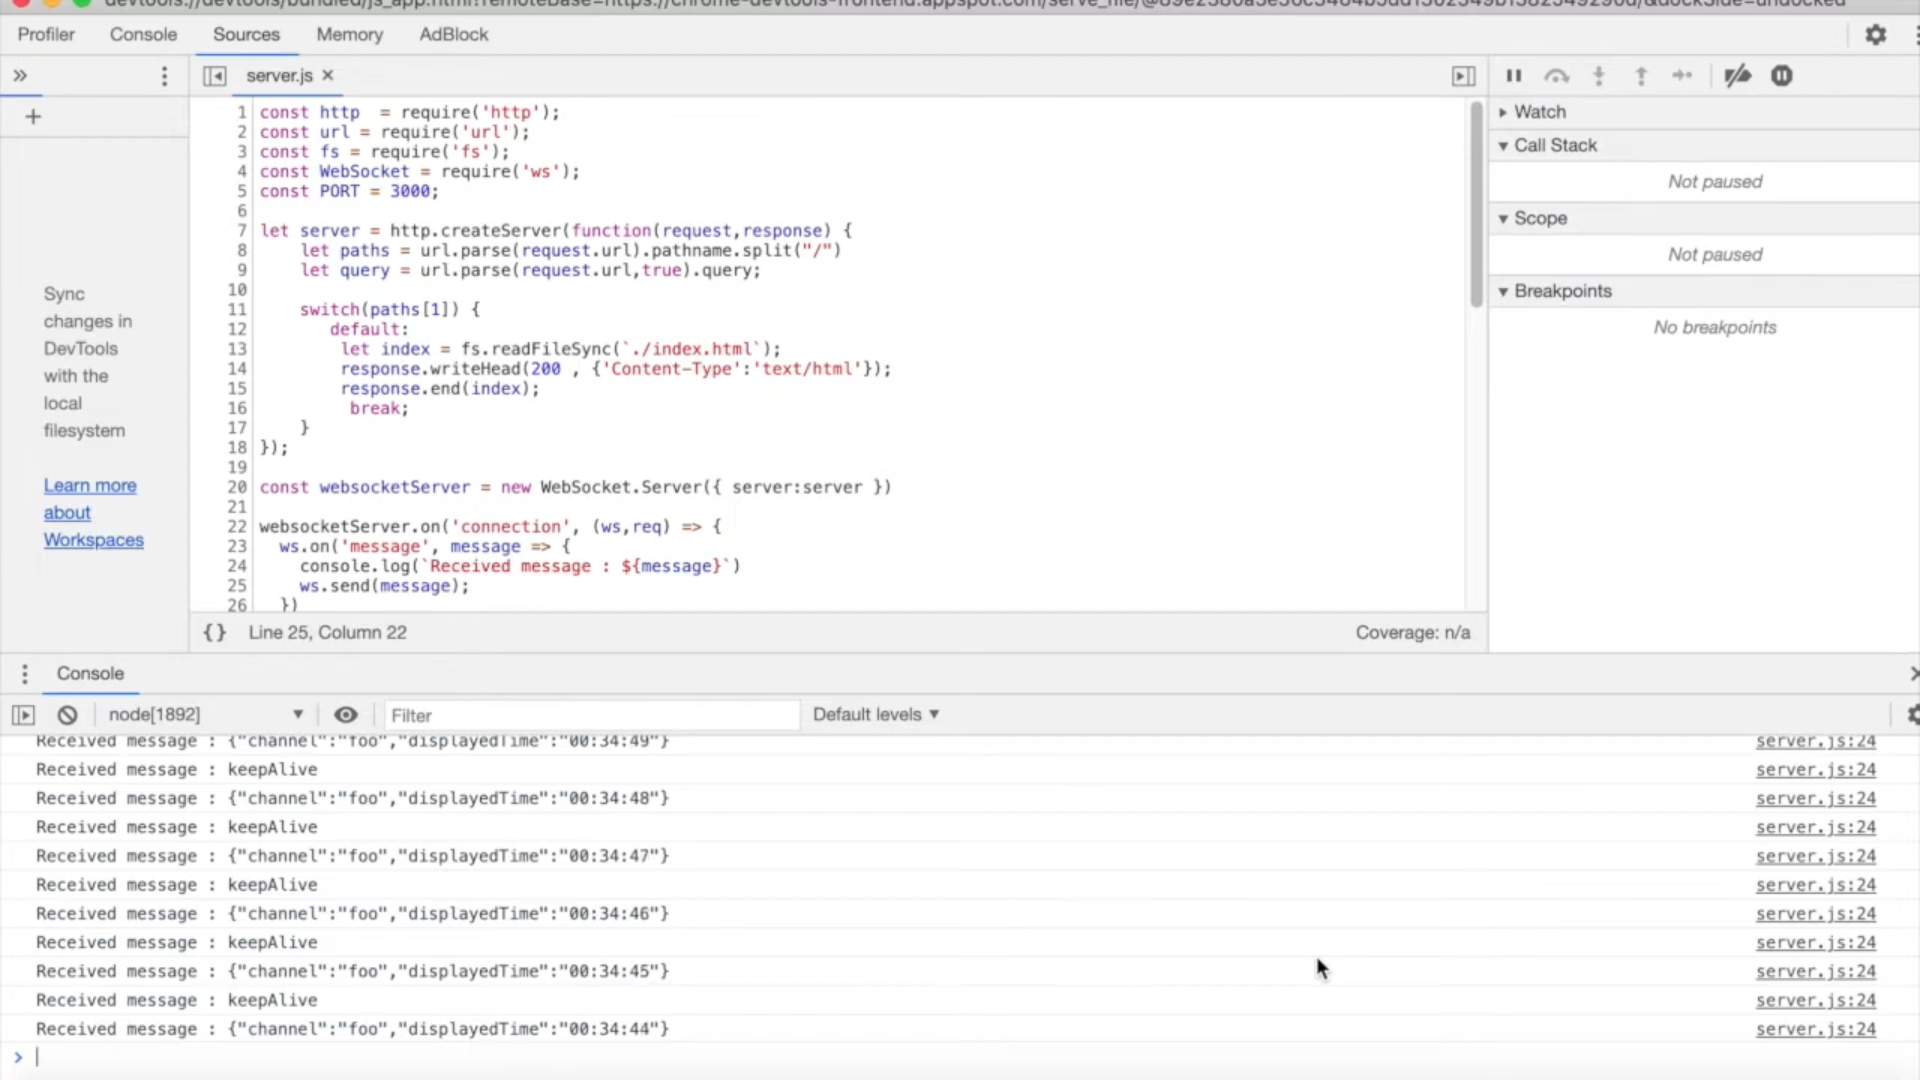
Show the log of nodeJS

Profiling Node.js Applications
Node.js built-in profiler can help provide insight into application performance.
To illustrate the use of the tick profiler, we will work with a simple Express application. Our application will have two handlers, one for adding new users to our system, and another for validating user authentication attempts:
app.get("/newUser", (req, res) => {
  let username = req.query.username || "";
  const password = req.query.password || "";
  username = username.replace(/[!@#$%^&*]/g, "");
  if (!username || !password || users[username]) {
    return res.sendStatus(400);
  }
  const salt = crypto.randomBytes(128).toString("base64");
  const hash = crypto.pbkdf2Sync(password, salt, 10000, 512, "sha512");
  users[username] = { salt, hash };
  res.sendStatus(200);
});

app.get("/auth", (req, res) => {
  let username = req.query.username || "";
  const password = req.query.password || "";
  username = username.replace(/[!@#$%^&*]/g, "");
  if (!username || !password || !users[username]) {
    return res.sendStatus(400);
  }
  const { salt, hash } = users[username];
  const encryptHash = crypto.pbkdf2Sync(password, salt, 10000, 512, "sha512");
  if (crypto.timingSafeEqual(hash, encryptHash)) {
    res.sendStatus(200);
  } else {
    res.sendStatus(401);
  }
});
Now assume that we've deployed our application and users are complaining about high latency on requests. We can easily run the app with the built-in profiler:
NODE_ENV=production node --prof app.js
and put some load on the server using ab (ApacheBench):
curl -X GET "http://localhost:8080/newUser?username=matt&password=password"
ab -k -c 20 -n 250 "http://localhost:8080/auth?username=matt&password=password"
and get an ab output of:
Concurrency Level:      20
Time taken for tests:   46.932 seconds
Complete requests:      250
Failed requests:        0
Keep-Alive requests:    250
Total transferred:      50250 bytes
HTML transferred:       500 bytes
Requests per second:    5.33 [#/sec] (mean)
Time per request:       3754.556 [ms] (mean)
Time per request:       187.728 [ms] (mean, across all concurrent requests)
Transfer rate:          1.05 [Kbytes/sec] received
...
Percentage of the requests served within a certain time (ms)
  50%   3755
  66%   3804
  75%   3818
  80%   3825
  90%   3845
  95%   3858
  98%   3874
  99%   3875
 100%   4225 (longest request)
Since we ran our application using the --prof option, a tick file was generated in the same directory as your local run of the application. It should have the form isolate-0xnnnnnnnnnnnn-v8.log (where n is a digit).
In order to make sense of this file, we need to use the tick processor bundled with the Node.js binary. To run the processor, use the --prof-process flag:
node --prof-process isolate-0xnnnnnnnnnnnn-v8.log > processed.txt
Opening processed.txt in your favorite text editor will give you a few different types of information. The file is broken up into sections which are again broken up by language. First, we look at the summary section and see:
 [Summary]:
   ticks  total  nonlib   name
     79    0.2%    0.2%  JavaScript
  36703   97.2%   99.2%  C++
      7    0.0%    0.0%  GC
    767    2.0%          Shared libraries
    215    0.6%          Unaccounted
This tells us that 97% of all samples gathered occurred in C++ code and that when viewing other sections of the processed output we should pay most attention to work being done in C++ (as opposed to JavaScript). With this in mind, we next find the [C++] section which contains information about which C++ functions are taking the most CPU time and see:
 [C++]:
   ticks  total  nonlib   name
  19557   51.8%   52.9%  node::crypto::PBKDF2(v8::FunctionCallbackInfo<v8::Value> const&)
   4510   11.9%   12.2%  _sha1_block_data_order
   3165    8.4%    8.6%  _malloc_zone_malloc
We see that the top 3 entries account for 72.1% of CPU time taken by the program. From this output, we immediately see that at least 51.8% of CPU time is taken up by a function called PBKDF2 which corresponds to our hash generation from a user's password. However, it may not be immediately obvious how the lower two entries factor into our application (or if it is we will pretend otherwise for the sake of example). To better understand the relationship between these functions, we will next look at the [Bottom up (heavy) profile] section which provides information about the primary callers of each function. Examining this section, we find:
   ticks parent  name
  19557   51.8%  node::crypto::PBKDF2(v8::FunctionCallbackInfo<v8::Value> const&)
  19557  100.0%    v8::internal::Builtins::~Builtins()
  19557  100.0%      LazyCompile: ~pbkdf2 crypto.js:557:16
   4510   11.9%  _sha1_block_data_order
   4510  100.0%    LazyCompile: *pbkdf2 crypto.js:557:16
   4510  100.0%      LazyCompile: *exports.pbkdf2Sync crypto.js:552:30
   3165    8.4%  _malloc_zone_malloc
   3161   99.9%    LazyCompile: *pbkdf2 crypto.js:557:16
   3161  100.0%      LazyCompile: *exports.pbkdf2Sync crypto.js:552:30
Parsing this section takes a little more work than the raw tick counts above. Within each of the "call stacks" above, the percentage in the parent column tells you the percentage of samples for which the function in the row above was called by the function in the current row. For example, in the middle "call stack" above for _sha1_block_data_order, we see that _sha1_block_data_order occurred in 11.9% of samples, which we knew from the raw counts above. However, here, we can also tell that it was always called by the pbkdf2 function inside the Node.js crypto module. We see that similarly, _malloc_zone_malloc was called almost exclusively by the same pbkdf2 function. Thus, using the information in this view, we can tell that our hash computation from the user's password accounts not only for the 51.8% from above but also for all CPU time in the top 3 most sampled functions since the calls to _sha1_block_data_order and _malloc_zone_malloc were made on behalf of the pbkdf2 function.
At this point, it is very clear that the password-based hash generation should be the target of our optimization. Thankfully, you've fully internalized the benefits of asynchronous programming and you realize that the work to generate a hash from the user's password is being done in a synchronous way and thus tying down the event loop. This prevents us from working on other incoming requests while computing a hash.
To remedy this issue, you make a small modification to the above handlers to use the asynchronous version of the pbkdf2 function:
app.get("/auth", (req, res) => {
  let username = req.query.username || "";
  const password = req.query.password || "";
  username = username.replace(/[!@#$%^&*]/g, "");
  if (!username || !password || !users[username]) {
    return res.sendStatus(400);
  }
  crypto.pbkdf2(
    password,
    users[username].salt,
    10000,
    512,
    "sha512",
    (err, hash) => {
      if (users[username].hash.toString() === hash.toString()) {
        res.sendStatus(200);
      } else {
        res.sendStatus(401);
      }
    },
  );
});
A new run of the ab benchmark above with the asynchronous version of your app yields:
Concurrency Level:      20
Time taken for tests:   12.846 seconds
Complete requests:      250
Failed requests:        0
Keep-Alive requests:    250
Total transferred:      50250 bytes
HTML transferred:       500 bytes
Requests per second:    19.46 [#/sec] (mean)
Time per request:       1027.689 [ms] (mean)
Time per request:       51.384 [ms] (mean, across all concurrent requests)
Transfer rate:          3.82 [Kbytes/sec] received
...
Percentage of the requests served within a certain time (ms)
  50%   1018
  66%   1035
  75%   1041
  80%   1043
  90%   1049
  95%   1063
  98%   1070
  99%   1071
 100%   1079 (longest request)
Yay! Your app is now serving about 20 requests per second, roughly 4 times more than it was with the synchronous hash generation. Additionally, the average latency is down from the 4 seconds before to just over 1 second.
Hopefully, through the performance investigation of this (admittedly contrived) example, you've seen how the V8 tick processor can help you gain a better understanding of the performance of your Node.js applications.